What is Gamification?
Gamification is the application of features commonly used in games to a non-game environment with a goal of improved performance or outcomes as the result of increased motivation and competition. It is important to note that Gamification is NOT:
- Playing games
- Adding game features for the goal of making something “fun” regardless of the outcome
Limited Time Offer

Get a free AI and visual data analysis from NGNInsights
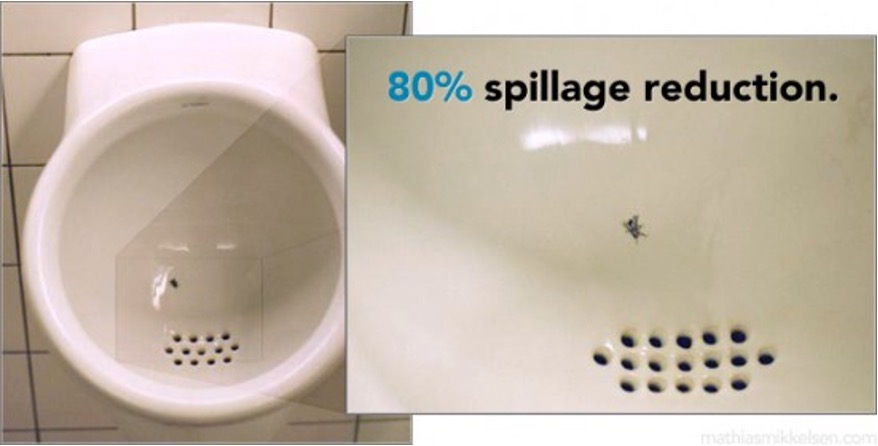
My favorite example of gamification is found in of all places, public men’s bathrooms. Airports were the first to start painting or applying stickers of “fake flies” or other objects into urinals. “When flies were introduced at Schiphol Airport, spillage rates dropped 80 percent”. A change like that, of course, translates into major savings in maintenance costs.
Other successful and older examples of gamification include:
The “toy” included boxes of Cracker Jack
Points with major Credit Card Carriers
Frequent Flyer Airline Miles
Buy 10 get 1 free punch cards
We don’t always think of these as “Gamification” because they were implemented prior to the creation and marketing of the buzz word. In this article I want to dive down into what Gamification is and what it isn’t and how you can use it to increase performance and generate ROI in your Contact Center.
Successful Gamification IS NOT Games, it is Improved Performance
Gamification has become a buzzword and like other buzzwords that are used to drive marketing attention and sales, the real meaning and original purpose of the word is often obscured if not completely lost.
Let’s take an example of using Gamification in a Contact Center environment – a leaderboard. At its most simplistic form a leaderboard is just simply a filtered report ordered from best to worst. You select a data point, say After Call Work or ACW duration, and then filter for a specific period and possibly filter for a specific set of agents and then sort that list by shortest duration on top down to the longest duration on the bottom. Here are side by side screenshots of a “Report” result for ACW duration and then a “Leaderboard” for shortest ACW:
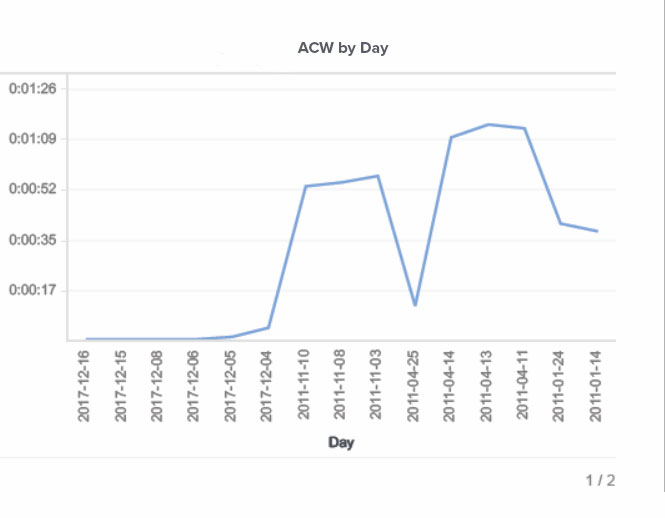
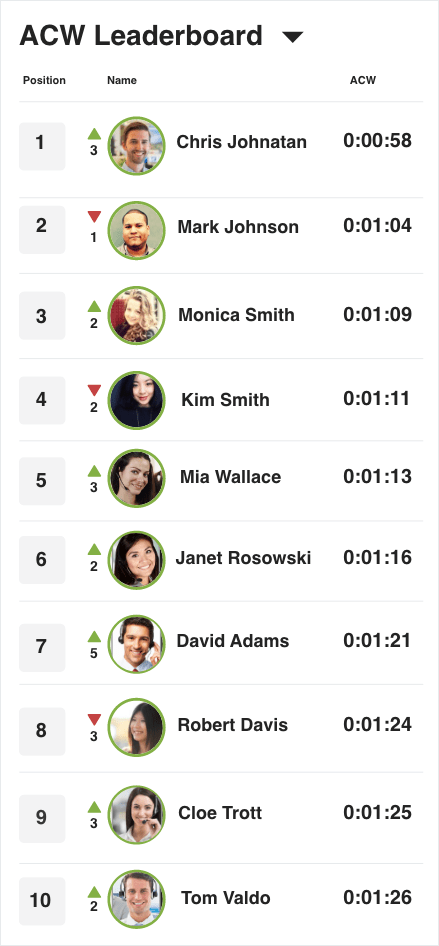
Gamification is identifying and appreciating the differences between the “Report” and the “Leaderboard”. Taking the same data but presenting it in a way that does more than a “Report” simply displaying historical results and turning it into a “Leaderboard” you show the real time position of each agent against each other. What makes a great leaderboard? It might be obvious to some, but it is a good exercise to be specific:
Visual display that highlights the top performance. Note how even if you sort an ACW report to display shortest to longest duration, there isn’t anything visually that offsets the top (#1 or shortest) entry on the list. A quality leaderboard will use techniques such as bolding, larger font size, background highlighting, and more to visually offset the top results. Top 3 is common as we think in terms of Olympian Gold, Silver, and Bronze, but depending on the total number of agents making up the leaderboard it could be a top 5 or top 10 that is visually enhanced.
NGNInsights, the gamification and agent performance platform from Grupo NGN, has two real time display options for leaderboards. The first is the supervisor or general display option. This option displays the common leaderboard you would expect to see listing the best performer at the top and then each agent in order of performance down to the bottom of the list. The second display is the personalized leaderboard each agent sees when logged into their NGNInsights account. This display will show the top 3 results and then specifically show the spot 1 above and 1 below the agent themselves. If the agent is in the top 3 the leaderboard will show the top 6 results. We do this so that when an agent views a leaderboard the visual focus is specifically:
The value needed to be #1
The value needed to be Top 3
The value or change in performance for the agent to move 1 spot up or 1 spot down on the leaderboard
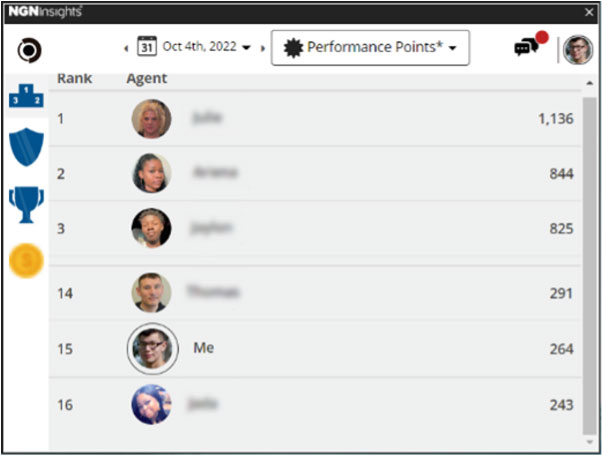
Note the goal of using leaderboards is not simply to make a “game” out of how long agents spend in ACW. The goal is to motivate agents to improve their performance. Not all agents, not all people, share the same motivation but the leaderboard display naturally creates a level of competitive motivation as agents see how their performance stacks up against other agents. No one wants to be at the bottom of a leaderboard and certain personalities will make extra effort to push their performance in order to be at the top of a leaderboard.
The real key to successful Gamification is in the end of the previous paragraph – by using techniques specific to games and turning a report into a leaderboard with specific visual techniques you have a real time tool to improve agent performance across the board.
Some of you are already thinking ahead of the game and brainstorming how you could add even more Gamification to a leaderboard, and we will discuss exactly that in the “Breaking Through Plateaus” section. Next let’s discuss the difference between successful Gamification and the risks that come with improper gamification.
Ludification vs Gamification
Gamification is the use of game features and techniques for motivation, problem solving, and performance improvement in a non-game environment. Often times people confuse Gamification with Ludification which is a system where you will only try to add fun to something that is not normally fun such as learning or more appropriately….. work.
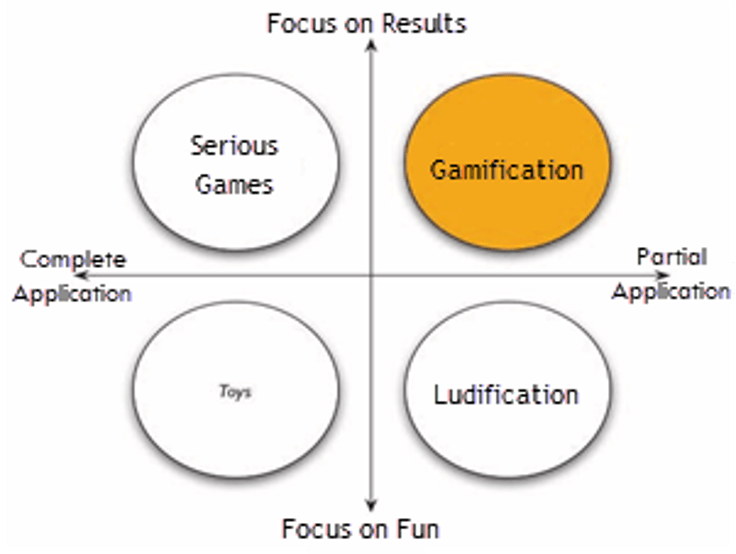
This chart can help conceptualize the practical differences between Gamification and Ludification.
Gamification focuses on the features of game theory in a limited application to a non-game environment.
Ludification focuses on turning a non-game environment into a game to make it fun.
If you take Gamification and apply it in totality to your environment, you have what is referred to as a “Serious Game”. One of the most popular Serious Games is Flight Simulator by Microsoft which is certainly a game but is so realistic that it is used for training and real-world simulation purposes. If your focus is on “Play” or “Fun” and you apply it in totality to your environment, you have what is effectively known as a “Toy”.
Companies that attempt to apply “Gamification” but in fact implement “Ludification” by focusing not on game theory and game techniques for motivation and performance improvement but rather in trying to add “fun” to the work environment, need to be aware of the risks involved! The largest (and most often achieved) risk is the unintended consequences of demotivating your work force. Some things just aren’t meant to be……fun. That doesn’t mean work can never or should never be fun and it also doesn’t mean that something that isn’t fun can’t be enjoyable, meaningful, and fulfilling. But management that tries to force “fun” into every work situation loses credibility and trust with their employees.
Ludification, by definition, is not concerned with results or improving performance and it would be a mistake to assume that making something merely fun will improve performance. Oftentimes it is the exact opposite – adding “fun” to work decreases overall performance. See just about any episode of “The Office” for reference.
Random Outcomes are Great for Games but Bad for Business
The human brain does not want to accept truly random outcomes. Finding meaningful patterns in randomness is called Apophenia. Popular examples of Apophenia are the tendency to “see” objects in clouds or human faces in inanimate objects like tree trunks or a simple slice of toast.
A common negative example not normally related to Apophenia is the underlying reason for one of the major successes of Las Vegas: the Gamblers Fallacy. The human brain does not want to naturally accept that each roll of the dice, each spin of the roulette table or each dealing of the cards is an independent event with independent odds. Gamblers want to perceive patterns or meaning in random numbers, often (incorrectly) interpreting a pattern as an indication of a coming win.
Randomness is a significant part of what makes games “fun”. Go and Chess are two examples of games that severely limit or completely remove randomness and that fact is a large part of why those games are more niche and require a level of commitment compared to say Life or Monopoly which relies on the random nature of dice and cards to ensure that each gameplay experience is different and while strategy is an important part of the game, the best strategy may not always assure winning the game.
When it comes to utilizing random outcomes and your Contact Center think of the famous slogan “What happens in Vegas, stays in Vegas”. You don’t need to accept decreased or random performance and outcomes as part of adding Gamification to your business. With NGNInsights – it’s the exact opposite.
Real Results from NGNInsights Users
California Regional MLS the agent performance and gamification platform NGNInsights in February 2022 and has seen agent schedule adherence improve from 82.2% to 88.3%. Overall the agents increased the company’s schedule adherence standard by 10% with NGNInsights from 77.6% to 87.3%.
CRMLS built an NGNInsights tile tracking 8 KPIs:
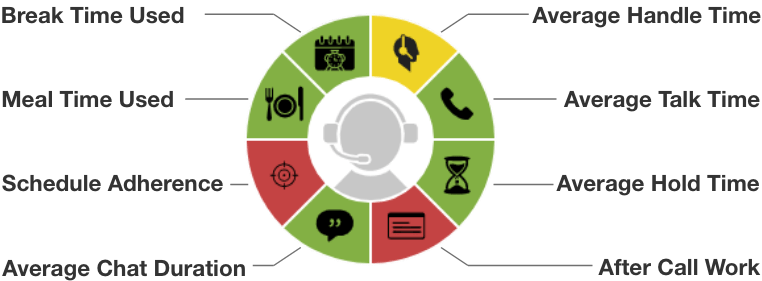
Data from September – December 2021 was loaded into the NGNInsights platform for baseline analysis and January data was analyzed while CRMLS supervisors worked with Grupo NGN to finalize implementation and prepare for agent roll out of the system in February 2022.
Another example comes from a Top Auto Club and Insurance provider that has reduced the Average Handle Time which has continually saved them $1,000,000 in FTE costs per month using NGNInsights. This national brand with 500 inbound support agents handling more than 75,000 calls per day calculated that every 1 second of decrease to their Average Handle Time would equate to the value of 1 full time employee (FTE). Between reducing After Call Work and improvements in Average Hold Times and Talk Duration using NGNInsights this customer saw a reduction of 27 seconds per agent per call. This customer also sees additional performance improvements in their NPS scores, Referral %, and Schedule Adherence.
Yet another example comes from a popular Cable provider. They have achieved more than a 3.75X improvement on upselling additional products associated to their Cable TV and Internet service. Averaging an Upsell rate of 5.1% before NGNInsights, they had the absolute need to increase the numbers. The decision was to use NGNInsights to achieve the higher goals.. With the ability to customize their NGNInsight Tile, a new Up-Sell % KPI was added to the NGNInsights’ Tile, making it a focus point for their Agents and Supervisors. No other changes were made ontop of any additional or specific contest or rewards for motivation, the KPI was simply added to the NGNInsights tile and followed with an email to their Agents and Supervisors. In the first month, the Up-Sell % increased to 19.9%. After making a slight change to the Up-Sell script, the following months the goal achieved more than 21%! The Up-Sell rate has maintained a range between 19%-24% for more than 10 months since the original KPI tiles was added.
warm leads that were submitted from an online form that express interest in returning to school. This customer agreed to run an A/B test with 35 agents randomly selected to use NGNInsights with the other 35 agents continuing with their same set up. During the 2 months test the entire floor saw an increase from 1.18 Leads Per Hour (LPH) to a total of 1.48 LPH. However, the agents using NGNInsights improved from 1.18 LPH to 1.79 a more than 51% improvement while the agents that were not selected to use NGNInsights improved from 1.18 LPH to 1.36 LPH.
Breaking Through Plateaus
One of the most common patterns we see with Contact Centers that implement NGNInsights are significant jumps in performance over the first 30-90 days followed by a plateau before seeing new performance improvements.
The initial performance jumps are often the result of simply putting data in front of your agents and supervisors in a simple and straightforward visual manner. When agents are able to see their data in real time, they more often than not feel empowered and take personal responsibility to improve like a apple or fitbit watch. Supervisors are able to use those previous hours spent on analyzing spreadsheets with observing the visual results in seconds providing the Supervisors the precious time to focus on those agents who need a little additional coaching or identifying key attributes of those top performers. Supervisors making these key decisions in seconds rather than hours results in a direct impact to the overall performance of the Contact Center. But what do you do once the honeymoon is over and those improvements plateau?
NGNInsights offers 5 areas of additional Gamification that can be rolled out over whatever time frame makes the most sense for each customer. These additional Gamification features allow your agents and supervisors to break through performance plateaus and see continued areas of improvement.
- Points System
- Awards
- Leaderboards
- Achievements
- Store
Each of these features can be used independently or in concert as it makes the most sense for each customer.
Total Experience (TX) with Grupo NGN
By applying these techniques, Grupo NGN ensures that your Gamification implementation correlates with significant Agent and Supervisor performance increases. All of your agents will have a consistent open real time feedback loop of their performance with their Supervisors. Any concerns or feeling that improvement enhancements and rewards are “subjective” will be replaced with objective KPI performance-based goals. Additionally, managers and supervisors obtain a significant improvement in their performance by being able to focus, in a simple manner, on the members of their teams that need the most help.
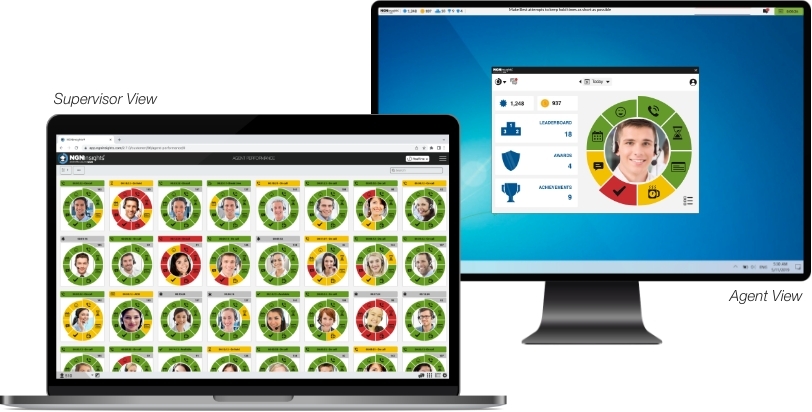
This is all part of our Total Experience or TX solution at Grupo NGN. By ensuring that you have the best possible Agent Experience and Management Experience you will provide word class Customer Experience.
Whats Next
We are willing to put our pocket book with what our words have been saying(mouth is saying) by offering you a test drive of how NGNInsights can not only improve your agent’s performance and but also increase your Contact Cener’s ROI.
All we need is ! (do not include PCI data). Simply provide us with a .CSV file including up to 180 days of data on a per agent and per day basis. We will take that file and generate an NGNInsights widget and apply our AI benchmarking system to identify the best areas of improvement for your Contact Center. This will give you a full test drive of the NGNInsights platform to identify how your agent’s performance matches your expectations and goals.
The cost associated with this test drive is Zip, Zero and Nada! Let us show you what NGNInsights can do with your Data and how more successful you can be with the resources you currently have.


