NGNInsights
NGNInsights is a Contact Center performance and gamification tool developed by team of data analysts, video game developers, and the team at Grupo NGN with more than 200 years combined experienced in the Contact Center industry. The tool was originally developed for the US Pentagon and US Postal Service to simplify visually analyzing large amounts of data. The gamification features in NGNInsights motivates and empowers Contact Center agents and supervisors to perform at their best on a consistent basis.
Contact Centers around the world have benefited from NGNInsights. In this article we will review the initial steps of a complimentary analysis provided to a Contact Center making outbound calls to fundraise for non-profit organizations. Resulting in uncovering a key area of improvement as well as providing agents visual real time status bar showing their adherence to this key performance indicator, allowing them to make the proper corrections.
Data Connection
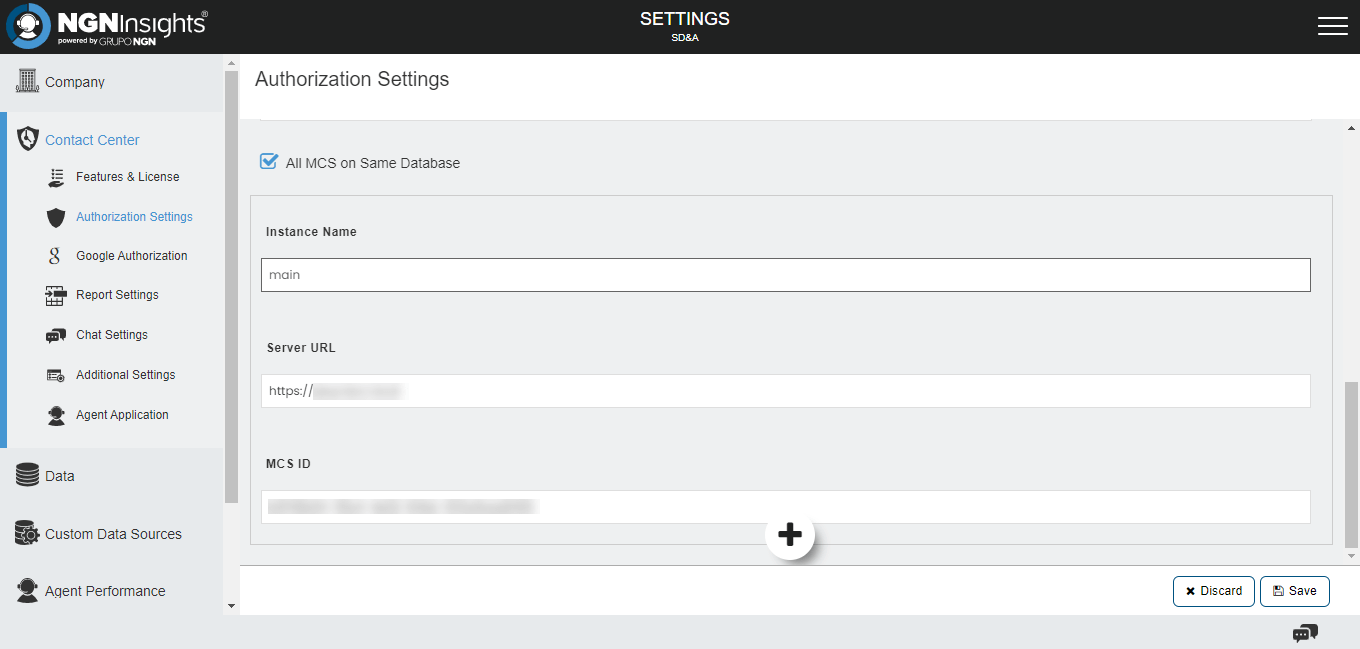
This Contact Center is already using NGNCloudComm so connecting their data with NGNInsights is a simple integration. Once the NGNCloudComm connection information is put into NGNInsights and an API connection is made with the Contact Center’s server, real time and aggregated data is populated into the platform.
NGNInsights has similar integrations with other major CCaaS platforms including Nice InContact, Amazon Connect, Five 9, Avaya, Genesys and more. Additionally, data from any source can be uploaded to NGNInsights by automatically uploading a CSV file to our Secure FTP server.
Once data is connected you will see empty tiles representing each agent with their individual performance results for each day. At this point a supervisor can Group, Sort, and Filter the data.

The next step is to determine the Key Performance Indicators or KPIs the Contact Center wants to focus on and to build a tile based on those Insights. For this Contact Center, the amount of money raised is an obvious KPI but the customer was not immediately certain on what other Insights it wanted to focus on.
Defining Success
While working with this Contact Center we designed an initial tile focused on the following KPIs or Insights:
- Average Handle Time
- Average Wrap Time
- Offline %
- Preview %
- Calls per Hour
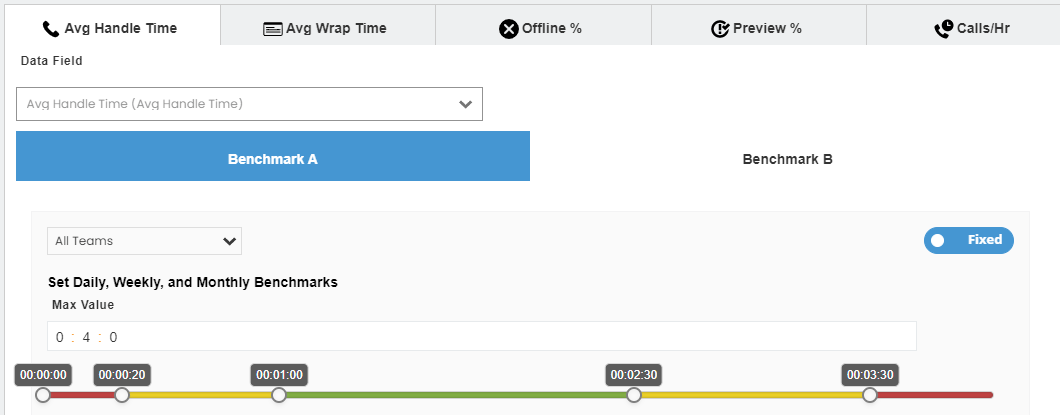
Green, Yellow, and Red benchmarks were initially set based on the current average performance of the agents.
Initial Analysis
While reviewing and analyzing the initial data to put together an improvement plan one data point stuck out – Preview Time.
Preview Time is the amount of time an agent spends reviewing a contact or lead sheet prior to pressing the option to dial out and connect with the lead. There was a wide range with some agents having a zero value for Preview Time meaning that every time that agent was presented with a lead they immediately dialed it; while other agents had large amounts of Preview Time. To dig deeper a custom Preview Time % data point was calculated by taking Total Preview Time and dividing it by Total Online Duration.
This started to show a more clear picture. Across all agents there was an average of 33.9% of Preview Time. If you removed the agents with zero Preview Time the average Preview Time was 50.6%! This means a large group of agents are spending more than half of their shifts previewing records rather than dialing and raising money.
Next, Agent data was Grouped by the Preview Time benchmark and a strong correlation was quickly uncovered. The more Preview Time by any agent, the less amount of money raised by that agent. Look at the table below showing the average money raised on a daily basis by the amount of Preview Time:
Date | Green Preview % Avg Money Raised | Yellow Preview % Avg Money Raised | Red Preview % Avg Money Raised | Difference Green to Red |
3/22/2023 | $1,426 | $620 | $187 | $1,239 |
3/23/2023 | $1,454 | $298 | $187 | $1,267 |
3/24/2023 | $2,572 | $593 | $99 | $2,473 |
3/27/2023 | $2,585 | $1,094 | $124 | $2,461 |
3/28/2023 | $1,671 | $442 | $62 | $1,609 |
3/29/2023 | $1,682 | $1,304 | $157 | $1,525 |
3/30/2023 | $1,442 | $1,247 | $121 | $1,321 |
3/31/2023 | $1,423 | $490 | $167 | $1,256 |
4/3/2023 | $2.51 | $1,732 | $138 | $2,369 |
4/4/2023 | $1,920 | $776 | $162 | $1,758 |
4/5/2023 | $1,249 | $1,557 | $140 | $1,109 |
4/6/2023 | $2,374 | $740 | $93 | $2,281 |
4/7/2023 | $2,264 | $1,150 | $180 | $2,184 |
4/10/2023 | $2,254 | $1,556 | $196 | $2,058 |
4/11/2023 | $1,743 | $1,066 | $173 | $1,570 |
4/12/2023 | $1,105 | $912 | $112 | $993 |
4/13/2023 | $1,227 | $674 | $173 | $1,054 |
4/14/2023 | $1,154 | $338 | $142 | $1,012 |
4/17/2023 | $1,204 | $421 | $344 | $860 |
4/18/2023 | $1,492 | $500 | $203 | $1,289 |
4/19/2023 | $1,013 | $781 | $191 | $822 |
4/20/2023 | $1,481 | $174 | $275 | $1,206 |
4/21/2023 | $1,536 | $343 | $195 | $1,341 |
4/24/2023 | $1,299 | $807 | $227 | $1,072 |
Average | $1,556 | $817 | $169 | $1,387 |
As you can see agents in the Green for Preview Time raise on average $1,387 more money than the agents in the Red.
That is an extra $1,387 per agent per shift improvement available to this Contact Center.
Next Steps
With this data in place, the Contact Center will roll out NGNInsights to their agents with a specific focus on reducing Preview Time.
Performance will be tracked to see how the agent Preview Time decreases across the board with the expectation that the average money raised will increase with the improved performance providing a direct and measurable increase to the Contact Center’s ROI.